
Loudness Graph
This script has been replaced by the new HeDaMixer Graph add-on for HeDaMixer script.
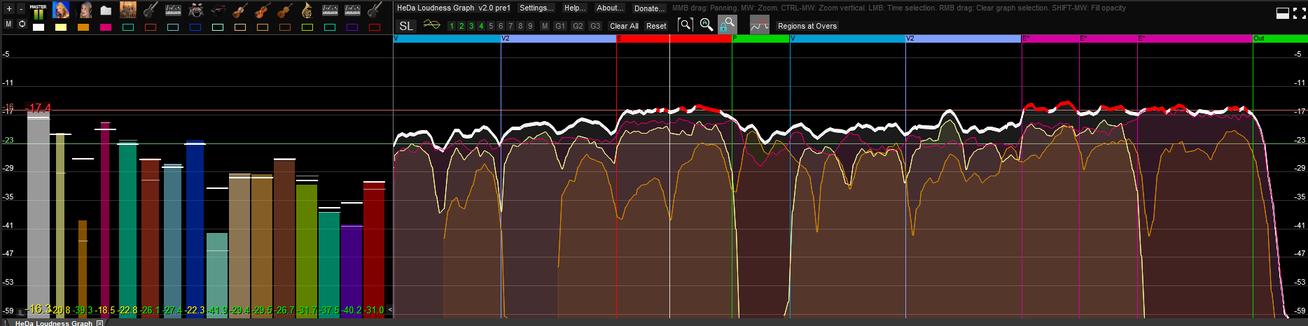
This scripts uses dpMeter II plugin from TBProAudio, and uses the reported Loudness values to plot meters and a graph of the loudness over time for each determined track. You can easilly add or remove tracks to be included, and they all plot in the same chart to compare loudness between them. You can also do a time selection, and it will report the Integrated Loudness of that part. You can Hide/Show tracks in the graph and save them as presets to quickly recall analysis configurations.