
Requirements
- REAPER 5.24 or newer
- SWS Extensions 2.8.3 or newer
- TBProAudio / dpMeter II v1.1.8 or newer
Why is dpMeter II needed? This script uses the dpMeter plugin made by TBProAudio for the Loudness analysis. It gets the number values from it and represents the meters and graph. - Powerful CPU: It is a CPU hungry script if you add many tracks to analyze. If you see some glitches in the graph it may be because the CPU is not powerful enough to draw the graph in realtime.
Installation
- Install the VST3 version of dpMeter II. The VST2 version doesn't work well with the script.
- Install HeDaScripts Manager if you haven't already and use it to download and install Loudness Graph.
- If you want, add the toolbar icon for the installed action HeDa_Loudness Graph VIP. The pack comes with a icon that is installed in your icons directory ready to be used for your toolbar.
Closing the script:
If you run the script again while it is running, a prompt will be presented to terminate the script.
You should click to remember the setting and click Terminate to close it.
New in 2.0
The new 2.0 version has changed the way you add and remove tracks. In version 1.x it inserted dpMeter in the track you select.. This had a problem that the fader trim gain or automation volume was not considered because they are after dpMeter in the signal flow. This has been solved by creating a post-fader send to a new track and insert dpMeter in this new track, which are grouped in a folder called "Loudness Graph folder". It's hidden by default because you don't really need to see these tracks. They are only for the analysis. There is a track named "-- LG last in folder". Do not remove this track or rename it. It is needed so the script finds it and adds new tracks inside this folder just above this last track in the folder.
In 2.0 version the order of the tracks is manual, giving the possibility to manual custom order in the meters. If you need to change the order in which the tracks appear in the meters area, you only need to rearrange these hidden tracks and click refresh button. You can see these hidden tracks in REAPER track manager window. You can even reorder them from this window. No need to unhide them.
There has been a major change too to the file format used to save the loudness graph data. So the previous .loudness files are incompatible with this version and a new format .loudnessgraph is used to avoid confusion.
All other new features in v2.0 are marked in red in this page.
Usage
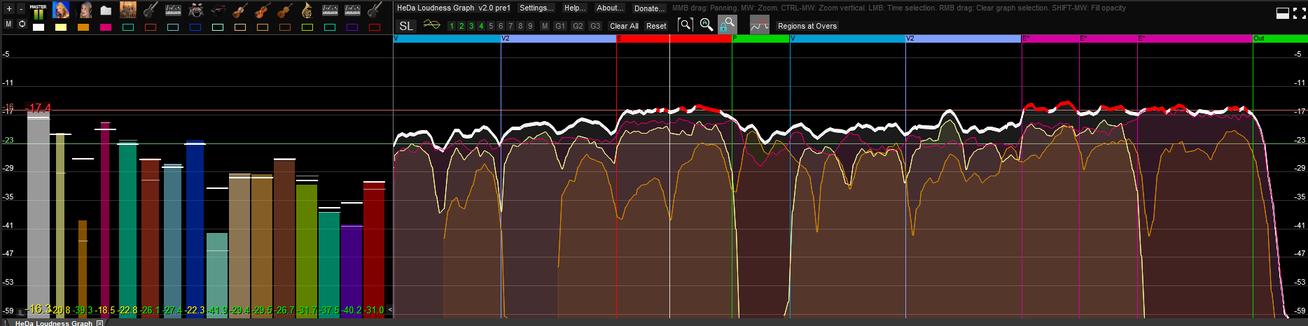
Meters Area:
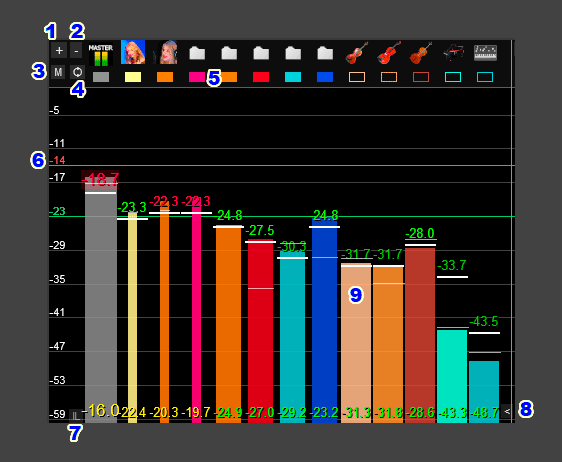
Adding / removing tracks to analyze
( 1 ) Adding tracks: Select one or multiple tracks and click the "+" (plus) Button on the left. This creates a post-fader send to a hidden bus track where dpMeter plugin is inserted for analysis. All hidden bus tracks are inside a folder named "Loudness Graph folder". You can see them in REAPER's track manager. When you exit the script, the dpMeters instances remain in the project, but bypassed. When you start the script again it will unbypass all the instances again.
( 2 ) Removing Tracks: There are two methods:
- In REAPER TCP area, select the track or multiple tracks you want to remove and click the "-" (minus) button on the top left.
- To remove a single track, you can ALT+click on the meter of the track in the script..
( 3 ) M Button: This quickly adds or removes the MASTER track.
( 4 ) Reordering tracks: In REAPER's track manger, you can see the hidden bus tracks in the "Loudness Graph folder". You can reorder them (drag and drop in the list ) Thenn click on the Ѻ button to refresh the tracks in HeDa Loudness Graph.
LMB: Left Mouse Button click RMB: Right Mouse Button click MMB: Middle Mouse Button click MW: Mouse Wheel
- ( 5 ) LMB on hide/show buttons (under track icons): Toggle Show/Hide a track in the graph display, but it will still be used in the meters and record the analysis graph.
- ( 5 ) LMB DRAG on hide/show buttons: Easy to Show/hide multiple contiguous tracks without having to click one by one.
- ( 5 ) CTRL+click on hide/show buttons: Solo Displays that track on the graph. It doesn't affect listening as CTRL clicking on the meter. Only the display on graph is changed.
- ( 6 ) LMB: change ML/SL overs value
- ( 7 ) IL button: Different displays of the IL lines and numbers of each track over the meters.
- ( 8 ) Lower right < button: Hide/Show the entire meters area. Click again to restore it.
- ( 9 ) LMB on a meter: Select the associated track and Scrolls view vertically to it.
- ( 9 ) RMB on a meter: Activates/Deactivates the analysis of the track on time selection. The graph will display loudness data after playing the time selection. It will also display the precise value of the graph for that track under the mouse cursor.
- ( 9 ) ALT + LMB on a meter: Remove track.
- ( 9 ) CTRL + LMB on the meter: Solo the track. Not soloed tracks will be displayed faded in the graph
- ( 9 ) MW: Adjust track's fader gain
- ( 9 ) MMB on meter: Match Track's fader to approximately get the IL under the coordinate of the mouse when clicked.
- ( 9 ) SHIFT + MW: Change the opacity of the meters
Graph Area:
The graph display is a representation of the meters in time and it is linked to REAPER timeline.
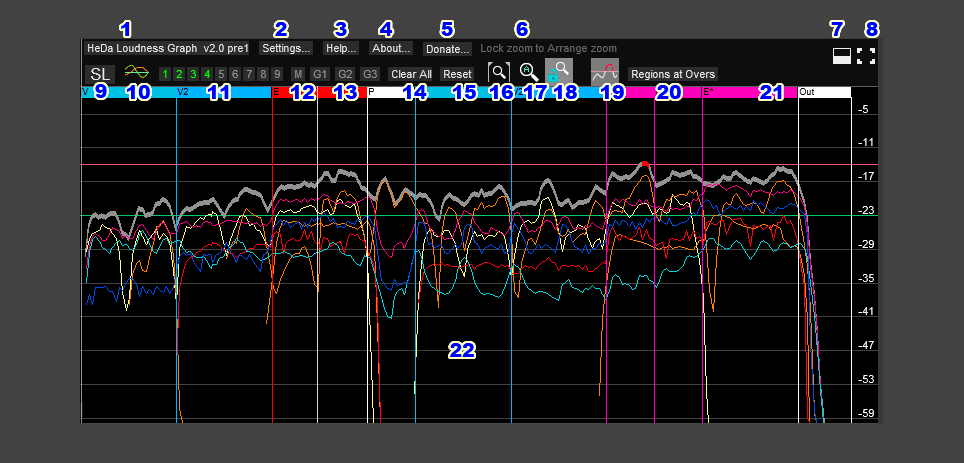
- ( 1 ) HeDa Loudness Graph button: Displays the change log
- ( 2 ) Settings: Opens the options panel with different settings described later.
- ( 3 ) Help: Opens the help panel with quick reference and a button for online full documentation page.
- ( 4 ) About: Displays about panel, with patrons and credits.
- ( 5 ) Donate: You can donate by paypal if you use this script. Any small amount counts. Thank you very much!
- ( 6 ) Tooltips: Hide/Show tooltips.
- ( 7 ) Dock/Undock window: Toggles between a floating window and a docked window.
- ( 8 ) Maximize/Restore window: It will float the window and make it the size of your primary monitor. The size can be configured in global options.lua file. It seems there is a limit of 2048 pixels at present time.
- ( 9 ) ML/SL/IL switch between modes (Momentary Loudness, Short term Loudness, Integrated Loudness analysis). It affects both the meters and the graph.
- ( 10 ) LMB: Cycles representation modes. Fill mode consumes more CPU. RMB: On/Off antialiased lines (antialiased lines are smoother but uses more CPU)
- ( 11 ) Display presets: there are 9 numbers to Save or Load presets on the hide/show status of the tracks RMB: Save the preset. It will become a green used slot. LMB: Load preset. loaded preset is in yellow.
- ( 12 ) LMB: Display only Master. RMB: Change horizontal offset in master display. This is 2 by default. 0 to disable. It is needed sometimes if latency affects the master analysis.
- ( 13 ) Groups G1 G2 G3 Display presets: There are 3 groups of displays that are automatically assigned by the track's suffixes. You can setup the prefixes in settings.LMB: Display only that Group in graph. RMB: Set the corresponding suffix for selected tracks.
- ( 14 ) Clear All: Clears all the graphs, resets, and clenas data file.
- ( 15 ) Reset: Forces a reset of the meters
- ( 16 ) LMB: Zoom to Time Selection: zoom to the current time selection. If there is not time selection it zooms to default zoom level.
- ( 17 ) LMB: Zoom All. It zooms from =START to =END markers in the project.
- ( 18 ) LMB: Lock zoom to arrange zoom. You can pan and zoom in the arrange and the Looudness graph will have the same zoom. You can still zoom and pan in the graph too and the arrange will follow.
- ( 18 ) Auto Scroll will always have the current play cursor position visible. This is only used if lock to arrange zoom is not used.
- ( 19 ) Overs: to toggle the highlight in red of loud areas above a specific threshold you can set in the options.
- ( 20 ) LMB: Inserts regions or markers (defined in settings) where the overs are (range defined in settings for SL and ML, and -23 for IL defined in global options if needed) Remove over markers: they are automatically removed when disabling overs.
- ( 21 ) LMB: Zoom to that region. RMB: Clears the graph in that region area.
Graph area:
- ( 22 ) LMB anywhere on the graph: Changes edit/play cursor position
- ( 22 ) Graph zooming and panning: MMB Drag middle mouse button to scroll the view. MW: to zoom in and out in the graph.
- ( 22 ) CTRL + MW: Changes the vertical scale.
- ( 22 ) SHIFT + MW: Changes the opacity of the filled graphs.
- ( 22 ) RMB Drag on graph: Clears graph of dragged area
- ( 22 ) LMB Drag on graph: Creates a time selection of the defined area. If a track has been activated for analysis (using RMB on meter) play cursor will go to the beginning of the time selection and start analyzing that part for Integrated Loudness. When cursor reaches the end of the selection it will stop calculating the IL and will display the final value and Maximum values.
- SPACE Bar key: Play/Stop
- ESC key: Removes time selection.
Track Analysis
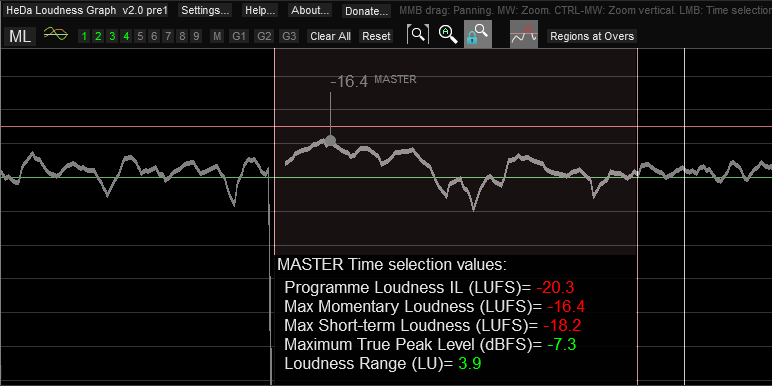
- RMB on Meter track: Enable track analysis for that particular track. It can be the master track or one of the tracks. When a track is armed for analysis, a dot will appear under the mouse on the graph displaying the graph value at that point for that track. When the play cursor enters the time selection area, it will reset the dpMeter and start analyzing the IL for that time selection and that track. When the play cursor reaches the end of the time selection the final IL value will be displayed on the graph.
- RMB on the same meter. Disable track analysis:
Settings:
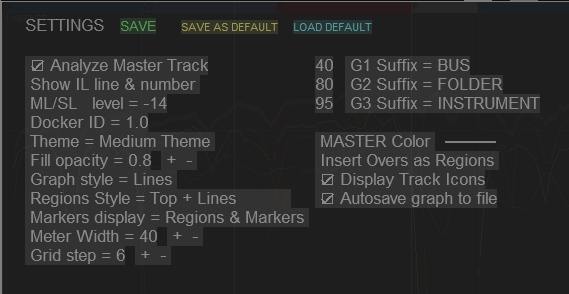
- Analyze Master Track: Show / Hide the master track meter and graph.
- Show IL line & number: Show / Hide the IL levels and numbers of each track over the meters.
- ML/SL level: Defines the level at which the overs are highlighted in red for SL and ML graphs. IL will use -23 level by default.
- Docker ID: REAPER doesn't support positioning the script's floating windows, and remember their positions in screensets. But you can dock the script window. Put it in its own docker and move that docker which are remembered in the screenset. The way to do this is to dock the script window, right clicking in the top of the script or title bar, and then use the little ! button in the docker and untick the "Attach Docker to main window". Now it will be floating around, but inside a docker. You can move the docker to another monitor and save the screenset. Next time you dock/undock the script it will remember the position in that monitor. Take note of the docker number provided in the Options window of the script. You can use that number to force docking to that docker on other projects that may have a different docker assigned.
- Theme: Three theme colors available. Dark, Medium and Light.
- Fill opacity: Affects the opacity of the fill in filled graph mode. Fill opacity also depends on the number of analyzed tracks. You can also modify the value on the graph by using SHIFT + Mousewheel.
- Graph style: You can change that also with the toolbar button. Lines, Solid fill + Lines (uses more CPU), Solid Fill (uses more CPU)
- Regions styles: Affects the way the regions are displayed on the graph. Hidden, Top, Top + Lines, Top + Lines with less opacity, Filled region + Top rectangle, Filled regions only.
- Markers Display: Use it if you want to display regions only, or markers only, both or none
- Meter Width: in pixels. Now it can be also changed dragging the separator between meters and graph.
- Grid Step: number of units for horizontal grid lines
- G1 G2 G3 suffix: Define the suffix used to determine the G1 G2 and G3 groups. The number at the left also defines the margin display for the meter of that group. You can define any number from 0 to 14 for each group. Entering 0 will draw a fat meter using all the width. Entering 14 will display a thin line meter. Groups are used to quickly have access to hide/show them in the graph by using the G1 G2 and G3 buttons on the toolbar. So you know that all tracks with certain suffix will be displayed when you click G1 for example.
- G1 G2 and G3 width percentage of meter width. It is possible to display different groups with different widths or all the same.
- Master Color: Click to define the color of the master track.
- Insert overs as: When you click Insert overs it will insert Regions or Markers as defined here.
- Display Track Icons: It consumes more CPU, so it can be disabled if you have many tracks.
- AutoSave graph to file: It saves the data file .loudnessgraph in the project directory each time you exit the script.
Tips
- It is recommended a powerful CPU if you intend to analyze many tracks at the same time.
- Sometimes, the graph is not drawn correctly, leaving gaps. Why is this? REAPER is giving more priority to other drawing operations, like scrolling the arrange window, for example, or you may have a dialog window opened and the script is not updated in the background. If you see blank spots on the graph while doing this, you can rewind, play again and let the graph be redrawn. Another reason can be that you are analyzing more tracks than your CPU can.
- You can reduce CPU usage by hiding tracks in the graph when you only need to see one track's graph. It reduces the number of lines it has to draw.